Get a 360° View of Your Community and Accelerate Smart Decision-Making
Unify your senior living operations data and put it to work with accessible, insight-rich custom dashboards
Breaking Down Data Silos
Our analytics solutions empower senior living providers to quickly assess financial, operational, and resident care performance in real time.
However, many Analytics project fail due to the inability to integrate with source systems and the inflexibility of the system. Our expertise lies in breaking down data silos, utilizing robotic process automation (RPA) to efficiently extract data from various sources, and delivering accessible, insight-rich custom dashboards.

Key Performance KPIs across LOBs for Senior Living
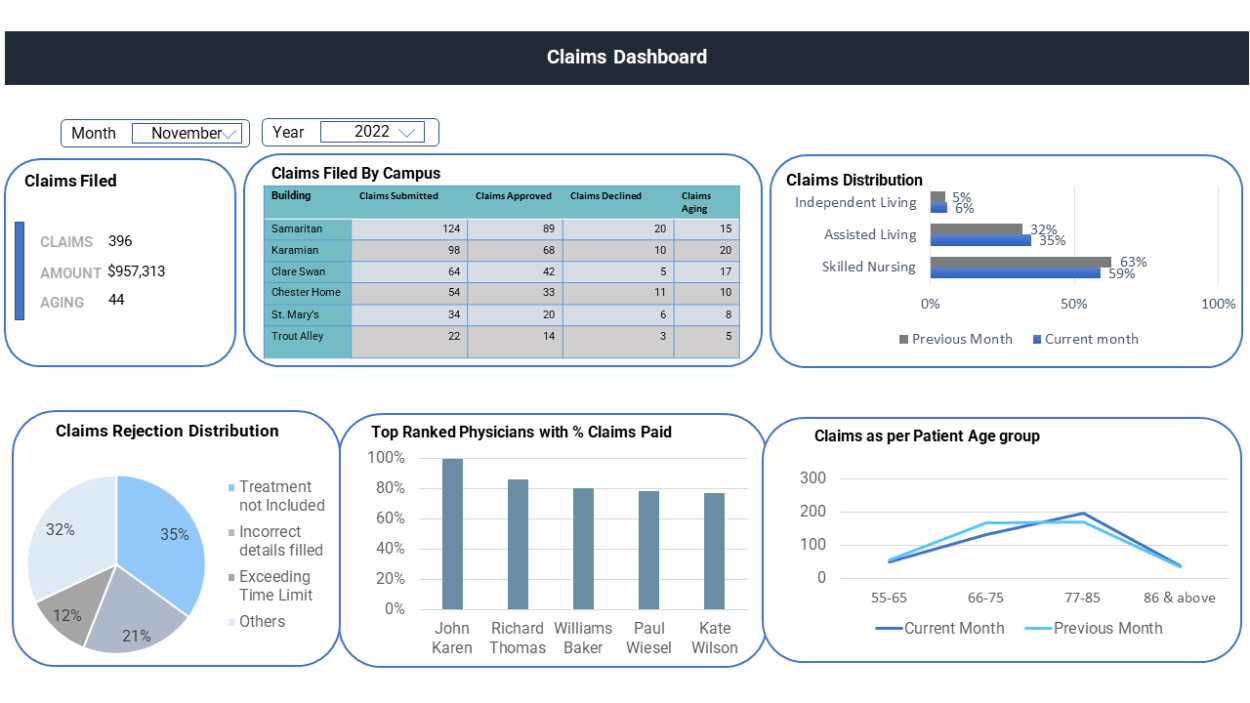
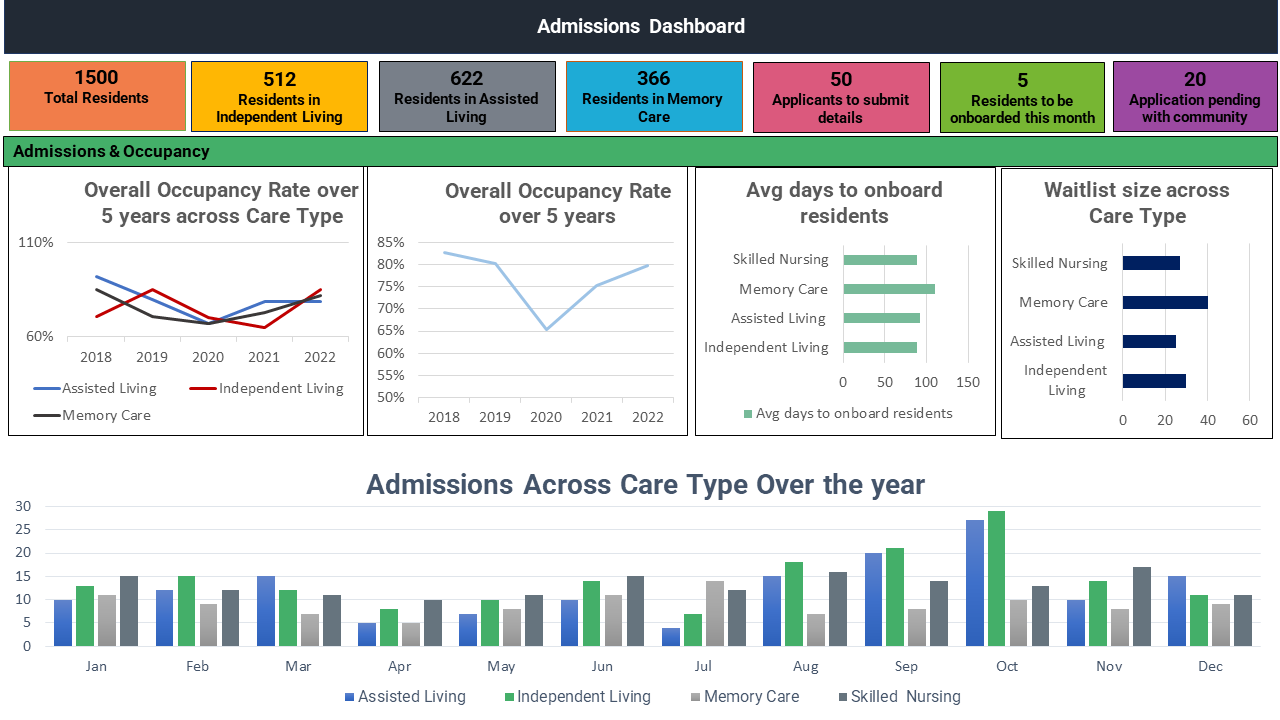
Operations
- It can be used to track a wide range of metrics that can help providers better understand the needs of their residents and allocate resources accordingly.
- Recognizing bottlenecks in the operational process.
- Providers can gain valuable insights into their operations and identify areas for improvement.
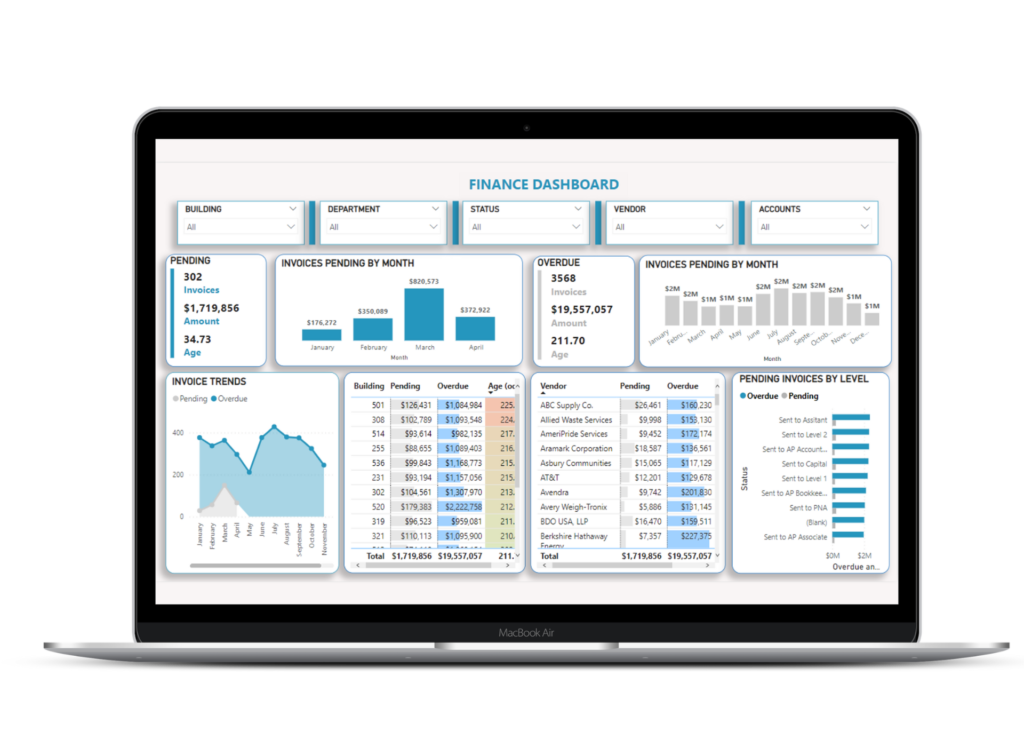
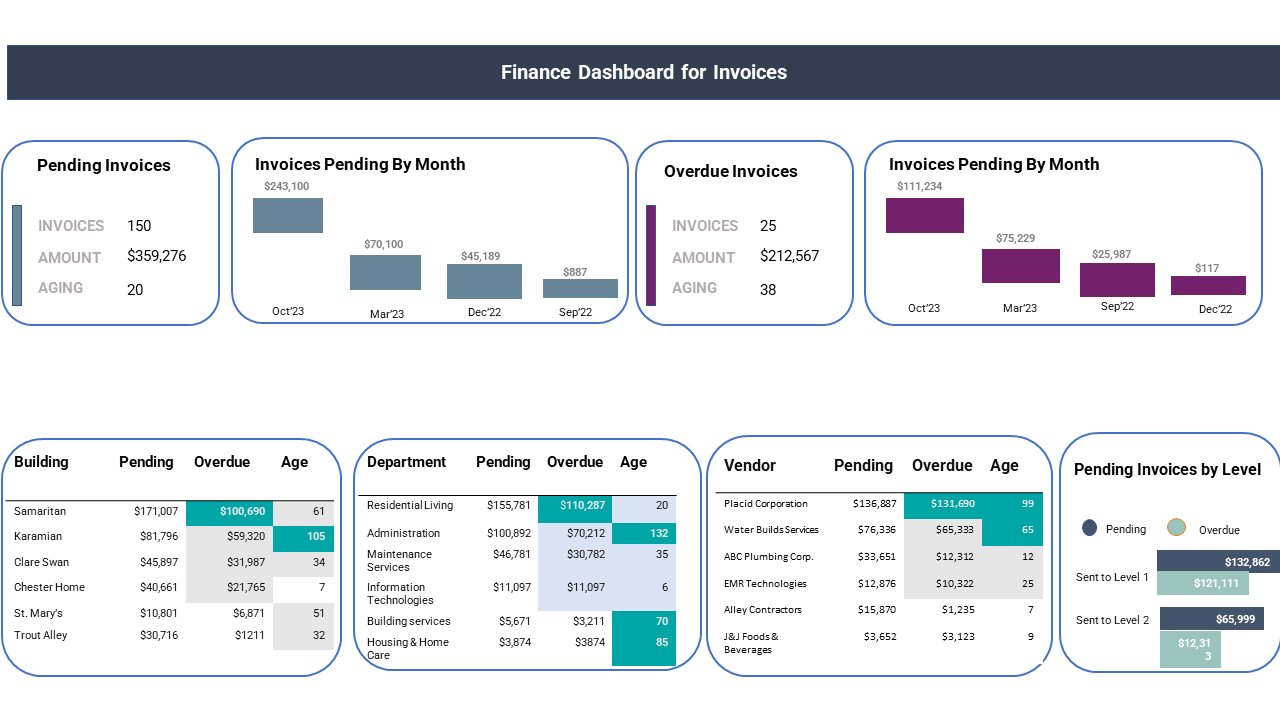
Finance
- It keeps track of financial metrics, including revenue, expenses, profitability, cash flow, return on investment (ROI), and net income.
- Identify trends and pinpoint areas for improvement, such as reducing costs, increasing revenue, and optimizing financial performance.
- Forecast future financial performance, allowing organizations to make informed decisions about budgeting, and resource allocation.
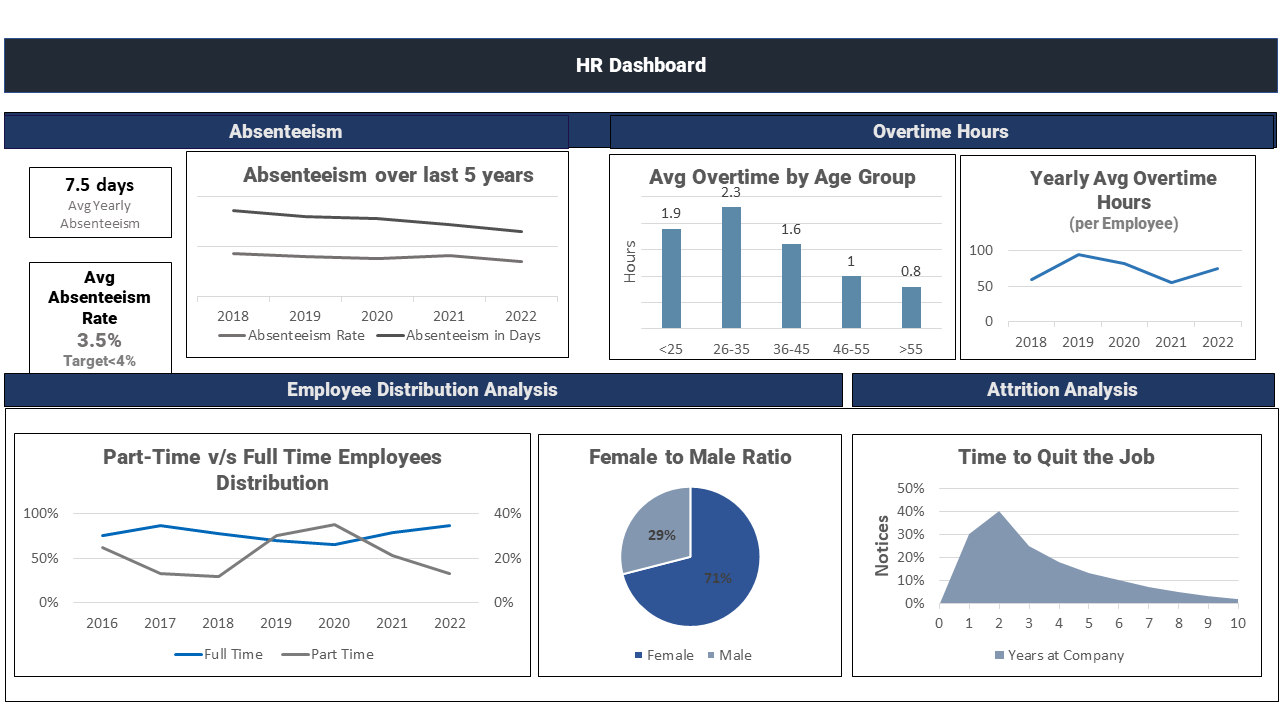
Human Resource (HR)
- Workforce planning including staffing levels, recruitment, & retention, employee performance, training & development, and compensation, and benefit
- Employee management in terms of recruitment, retention, performance, training, and other aspects of employee management.
- Thus gaining a quick 360-degree view of the data and employees across the organization.
Marketing
- Management of marketing efforts in the senior living industry, including web traffic and engagement, social media engagement, email marketing, and customer satisfaction.
- Identify areas for improvement in terms of engagement, conversion, advertising, & customer satisfaction.
- Thus making informed decisions to improve their marketing strategy to gain the attention of the right audience.
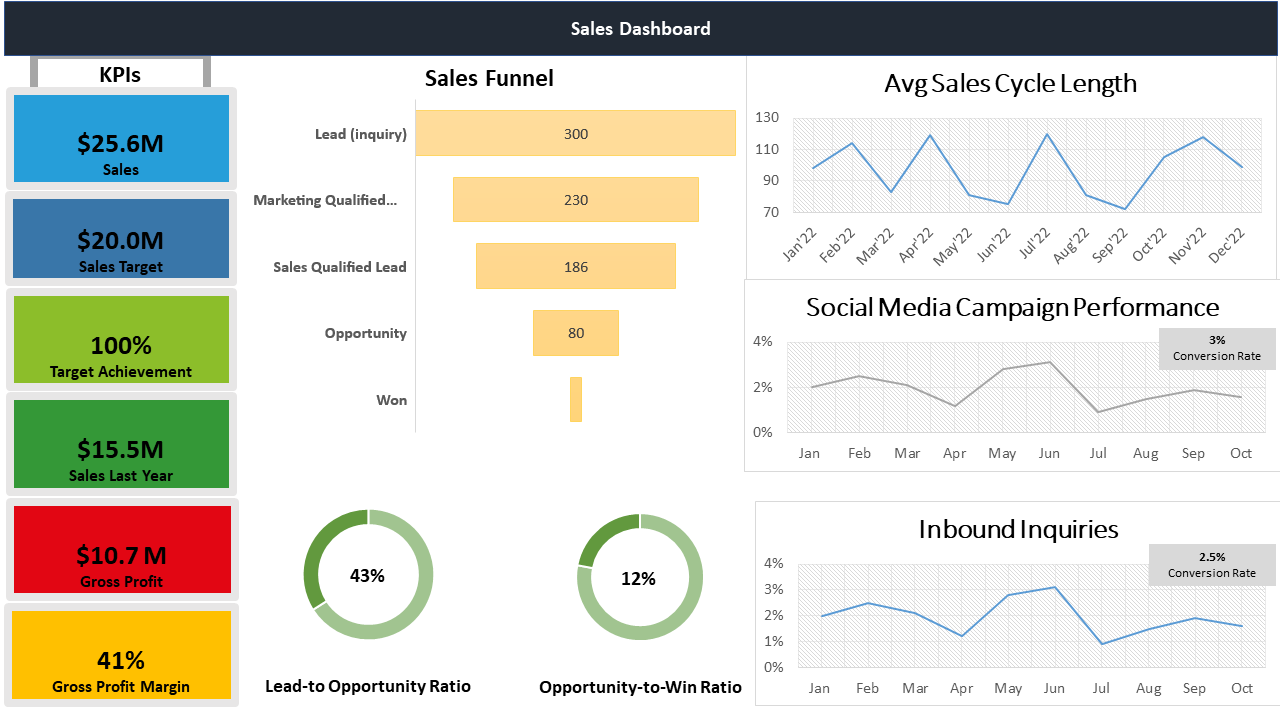
Sales
- Track a range of key metrics related to sales efforts, including sales team performance, lead generation, customer acquisition, & sales forecasting.
- Identify bottlenecks in terms of performance, lead generation, customer acquisition, & sales forecasting.
- Thus, can quickly take actions where the sales conversion can increase with minor changes and improve the profitability of the organization.
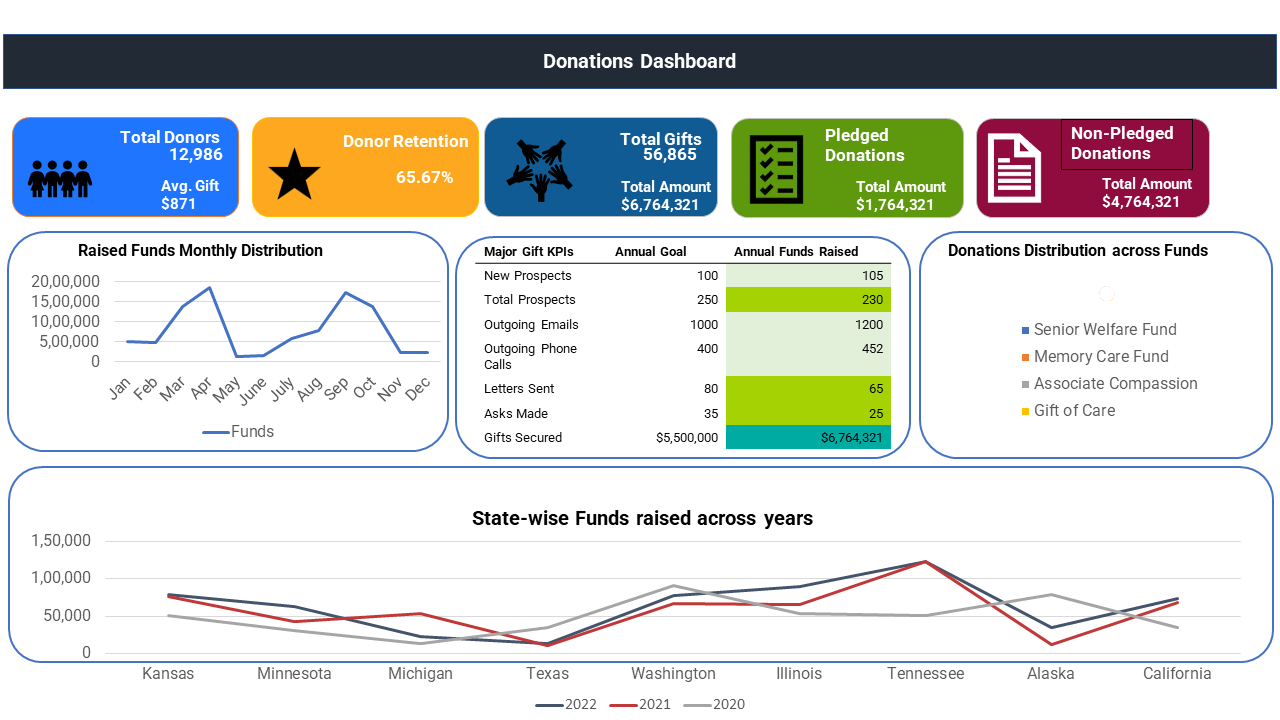
Fundraising by Foundations
- Track a range of key metrics related to fundraising efforts, including donor acquisition, fundraising campaigns, donor engagement, fundraising events, and grant applications.
- By doing so it can gain better insights into their fundraising efforts and identify pinpoints in the same.
- By tracking these key metrices, foundation departments can improve and speed up their fundraising campaigns across the year.
Uncover actionable insights for your community
Contact us now to discover how Analytics can empower your community, staff, and residents to thrive
With BI Analytics Dashboards, you’ll be able to:
Features of BI Analytics Dashboard
Our series of webinars focusing on the impact of AI - driven Automation on all aspects of Aging Services across functions

On-Demand Webinar
Streamline Resident Admissions: Achieve 80% Plus Efficiency Gain and Boost

On-Demand Webinar
Automate HR Processes to Save $1Million+ Annually and Improve Workflows for CCRCS

Upcoming Webinar
Leveraging AI to Enhance Operational Efficiency and Address Interoperability

Upcoming Webinar
Streamline Legacy Processes and Automate Key Finance Tasks to Save Millions
Knowledge Capsule
Read more about our latest news posts and be informed

2024: The Year Smart Tech Redefines Senior Living Technology Solutions
By 2030 over 20% of Americans will be 65+, with adults 85+ nearly doubling to 11.8 million. Already facing staff shortages, 29% of nurses may leave by […]

Automation and Analytics for Assisted Living Regulations & Compliance
Did you know that the number of Americans aged 65 and over is projected to double from 52 million in 2010 to 98 million by 2060? The […]

Boost Resident Experience with Smart Automation and Analytics
In today’s fast-paced world, senior living communities face increasing challenges in providing the best possible resident experience. Fortunately, smart automation and data analytics has emerged as a […]

AI Solutions for Aging Services: Enhancing Provider-Resident Experience
Current scenario of LTPAC Providers and Communities As the population ages and the demand for long-term care services grows, the aging industry isfacing significant challenges. A shortage […]
Unlock comprehensive insights for your community
An integrated and well-tuned Analytical solution that enables you to
-
Improve Operational Efficiency & the Resident Experience.
-
Eliminate ambiguity in your business processes.
-
Discover trends and gain insights into discrete data.