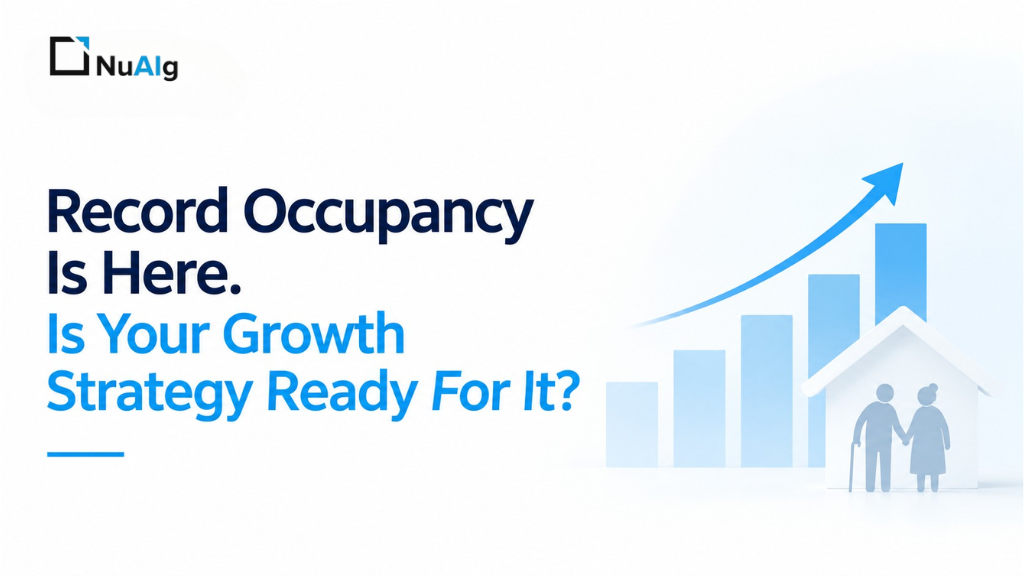
Senior housing occupancy reached 89.9% in the second quarter of 2026, the 20th consecutive quarterly increase, with independent living at 91.3% and assisted living at 88.4%, according to NIC MAP. New construction is growing at its slowest pace since NIC MAP began tracking supply data in 2006. NIC’s own analysts expect the industry-wide average to cross 90% by the end of the year, which would be the highest occupancy rate in the platform’s 20-year history. For the first time in a generation, senior living operators are not fighting to fill beds. They are fighting to keep up with demand they cannot build fast enough to absorb.
That sounds like a good problem to have. In some ways it is. But for CEOs and Executive Directors, record occupancy quietly creates a different kind of pressure than the one most growth strategies were built for.
The Waitlist Is No Longer Just a Waiting Room
For years, a long waitlist was a vanity metric, a sign that a community was popular. Now it is closer to a balance sheet item. Operators are reporting waitlists in the hundreds, with move-in rates that lag far behind, and some communities are turning waitlists into tiered membership programs with deposits ranging from a few thousand dollars to enter, up to tens of thousands for priority placement. That is a real strategic shift, and it only works if leadership can see, unit type by unit type, who is actually likely to move in and when.
That is the part most communities cannot answer with confidence today. Occupancy dashboards tend to report a single headline number. They rarely break it down by floor plan, care level, or expected turnover timing, which is exactly the level of detail a CEO needs to decide where to prioritize renovation dollars, where to hold pricing firm, and where a genuine unit shortage is costing real revenue every month it goes unaddressed.
Growth Strategy Now Depends on Forecasting, Not Just Reporting
The operators managing this moment well are not just tracking occupancy. They are forecasting it, at the unit level, using historical move-in and move-out patterns, local market penetration data, and resident acuity trends to predict where capacity will open up next and where genuine scarcity will persist. This is where a real Data Strategy and Services engagement earns its keep. It is the difference between a spreadsheet someone updates monthly and a live model that tells leadership which unit types will free up in the next quarter and which prospects on the waitlist are the best fit for them.
The same data discipline changes how a CEO thinks about capital. With inventory this constrained, a poorly timed renovation or a mispriced unit type is not a minor miss, it is lost occupancy the market will not forgive for years. Communities that can model demand by unit type are the ones making confident calls on where to expand memory care, where to hold independent living pricing, and where a waitlist signals real unmet demand versus simple prospect inertia.
Where This Usually Breaks Down
Most communities are not lacking the underlying data. Admissions systems, CRM records, and resident management platforms already capture move-in histories, unit preferences, and waitlist activity. The problem is that this data lives in three or four disconnected systems, and nobody has the bandwidth to stitch it into something leadership can actually act on. This is a common starting point for NuAIg’s AI Assessment, a focused engagement that maps what data already exists, where the gaps are, and what a realistic forecasting model would take to build, before any large investment gets made.
For organizations further along, this is also where AI Agents and CoPilots start to add real value, surfacing which waitlist prospects are ready to move now, flagging units approaching turnover, and giving admissions teams a prioritized daily list instead of a static spreadsheet.
The Next Step
Record occupancy will not last forever in every market, but for the next several years it is the environment most operators are planning in. The organizations that turn this moment into durable growth will be the ones that can see their capacity clearly enough to act on it, not just report it after the fact. If your team is still working from a single occupancy number instead of a unit-level forecast, that is usually the first gap worth closing, and it is exactly the kind of question an AI & Digital Enablement Sprint is built to answer.