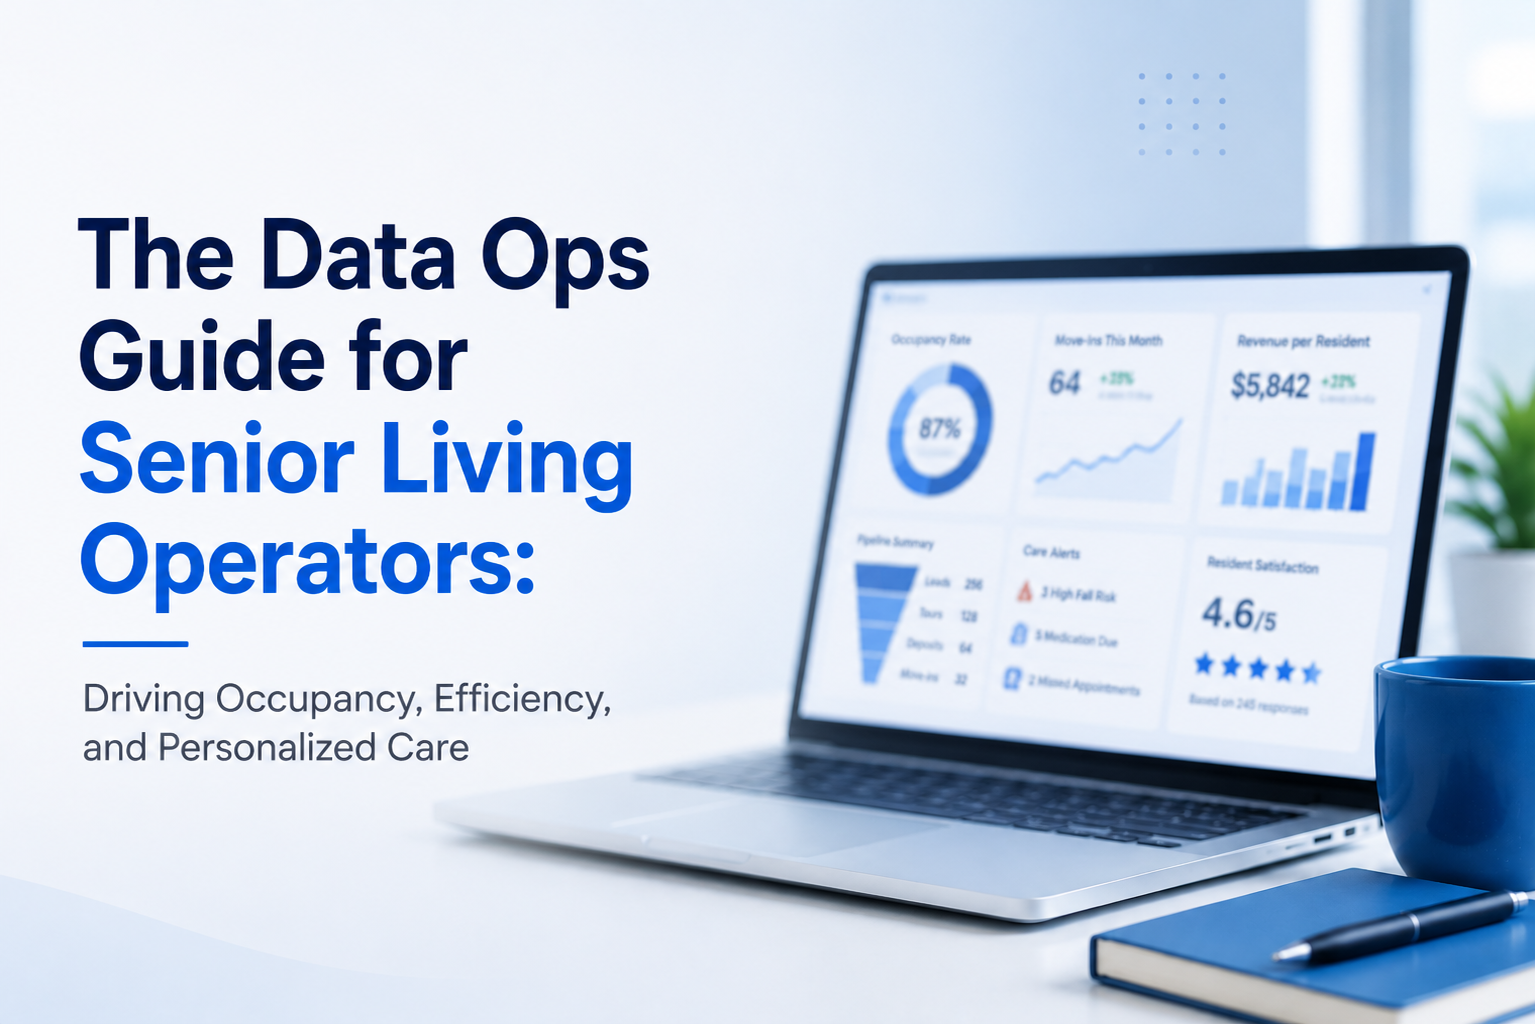
Discover how smart senior living operators are using data-driven insights to boost occupancy, reduce costs, and deliver personalized care that residents love.
Picture this: Instead of spending your Monday morning scrambling through spreadsheets you’re looking at a real-time dashboard that shows exactly where you stand today and predicts which residents might need extra attention this week.
This isn’t so far-fetched. Numerous senior living communities in the US are leveraging their data to create powerful dashboards. Operators embracing real-time business intelligence (BI) are witnessing remarkable results. They are enjoying higher occupancy rates, controlled costs, and happier residents, receiving truly personalized care.
Why Senior Living Needs a Data Revolution?
The senior living sector has traditionally relied on intuition and reactive decision-making. Today’s competitive landscape demands actionable insights delivered in real-time.
Modern residents expect transparency and personalized attention. Meanwhile, operators face pressure to maintain healthy occupancy, control rising labor costs, meet regulatory requirements, and demonstrate measurable outcomes.
What connects all these challenges is data. Without accurate, timely, and connected data, leaders are left making critical decisions based on intuition, experience, and gut feeling.
However, when data is added to the mix, decision makers can anticipate trends, optimize staffing, and personalize resident experiences.
NuAIg has built a comprehensive Data Operations Guide, which is designed to transform fragmented information into a strategic advantage for senior living providers.
Why do you need a Senior Living Data Ops Guide?
Steps to follow:
Essential KPIs Every Operator Should Track
Successful communities monitor these critical metrics:
Financial Health:
- Occupancy rates by unit type
- Revenue and cost per resident
- Net Operating Income drivers
- Payer mix optimization
Operational Excellence:
- Staff-to-resident ratios by shift
- Overtime and agency usage
- Resident satisfaction scores
- Average length of stay
These aren’t just numbers, they guide staffing decisions, pricing strategies, marketing investments, and care improvements.
Boosting Occupancy with Smart Analytic
From Reactive to Proactive Marketing
Traditional approach: “Occupancy dropped. Increase marketing budget.”
Data-driven approach: Real-time dashboards reveal that independent living units average 15 days from tour to move-in, but assisted living takes 28 days. Weekend tours convert 23% better, and physician referrals have the highest lifetime value.
Result: Immediately re-allocate budget to high-converting channels, schedule more weekend tours, and strengthen physician relationships.
Smart Lead Management
Modern BI systems track your entire sales funnel:
- Lead sources and quality scores
- Tour-to-inquiry ratios
- Conversion rates by team member
- Seasonal patterns and trends
- Unit availability aligned with prospect preferences
Controlling Costs Without Compromising Care
Staff Optimization
Staff represent 60-70% of operating expenses. The challenge isn’t just to control the cost but also to ensure that you hire and retain the right people, with the right skills, at the right time.
An example: Sunrise Manor discovered their Thursday evening shift consistently went into overtime due to inefficient handoffs and not due to the residents’ needs. By adjusting the staff schedule based on this insight, the community reduced weekly overtime by 18% while improving care continuity.
Beyond staffing Costs
BI systems should also track:
- Facilities: Preventive maintenance schedules and utility patterns
- Procurement: Vendor performance and inventory optimization
- Variance analysis: Connecting spending to resident outcomes
Personalizing Care at Scale
By integrating health records, medications, activities, nutrition, and safety data, analytics identify individual resident patterns that might otherwise go unnoticed.
Example: The system notices Mrs. Johnson’s blood pressure spikes on Tuesdays. Cross-referencing reveals she skips water aerobics when her daughter visits. Solution: Include family in gentle activities or reschedule therapy.
Predictive Analytics: Preventing Problems
Fall Prevention That Works
Traditional approach: React to falls with incident reports.
Predictive approach: Machine Learning analyzes EHR data, medications, sleep patterns, and mobility to identify fall risk 48-72 hours before incidents occur.
Precise interventions:
- Increased wellness checks
- Environmental modifications
- Adjusted medication timing
- Enhanced mobility assistance during risk windows
NuAIg’s Recommended Dashboards
- Executive Performance: Occupancy trends, NOI drivers, facility comparisons
- Sales & Marketing: Lead performance, conversion funnel, referral patterns
- Workforce Management: Census-aligned staffing, overtime patterns, skill mix
- Clinical Quality: Risk flags, incident trends, care pathway adherence
- Operations: Work orders, asset performance, utility consumption
Our Client Success Stories
Based on our experience working with senior living operators, here’s what we’ve observed in real implementations:
Operational Improvements:
- Significant reduction in time spent on manual reporting and data compilation
- Faster decision-making cycles when issues arise
- Better collaboration between departments with shared data visibility
Financial Performance:
- Meaningful improvements in occupancy rates within the first year
- Noticeable reductions in agency staffing costs through better scheduling
- Decreased preventable maintenance expenses through predictive insights
Care Quality:
- Reduction in preventable incidents like falls through early risk identification
- Improved resident satisfaction scores
- Better retention rates and longer average stays
While results vary based on each community’s starting point and implementation approach, operators consistently report that having real-time data transforms how they make decisions and serve their residents.
Getting Started
Your next steps:
- Assess current state: What data do you collect? Where are the pain points?
- Define priorities: Which KPIs would have the biggest impact?
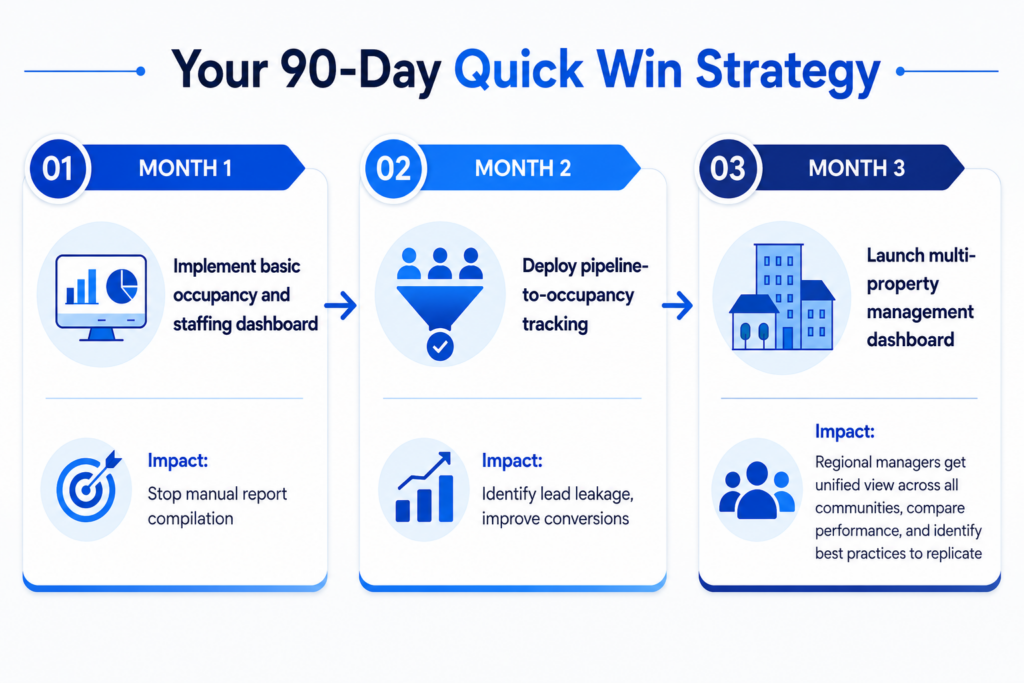
- Start small: Begin with occupancy or staffing dashboards
- Engage your team: Involve frontline staff in design
- Plan for growth: Choose scalable platforms
The Bottom Line
Senior living is at an inflection point. Communities embracing data-driven decisions will thrive, providing better care, stronger financial performance, and environments where residents, families, and staff all benefit.
Your residents deserve the best care. Your staff deserves efficient workflows. Your stakeholders deserve transparent performance. Real-time BI makes this possible.
The question isn’t whether you can afford to implement these systems but it’s whether you can afford not to!
NuAIg can help you get started with your own personalized Data ops strategy, yes every community is different, and requires different approaches!
Our Consulting team can assess your community’s current state, draft an entire high-level report about what’s working well, where the gap is and the report will also tell you importance vs impact, cost vs ROI and much more and that too in 45 days!